Programmatic benchmarks. Every channel. Real data.

Display, native, video, CTV, DOOH, and audio — in one report.

Performance data across 6 channels, 22 industry categories, and 10 ad exchanges — so you always know where your campaigns stand.

Get the Report
Green book cover titled The State of Programmatic Advertising with Growth Channel logo

Get the free report

The benchmarks your campaigns should be measured against — instant access, straight to your inbox.
No spam. We'll only email you about the report.

Please disable any ad blockers to successfully submit this form.

Thank you! Your submission has been received!
Oops! Something went wrong while submitting the form.

The device gap nobody talks about.

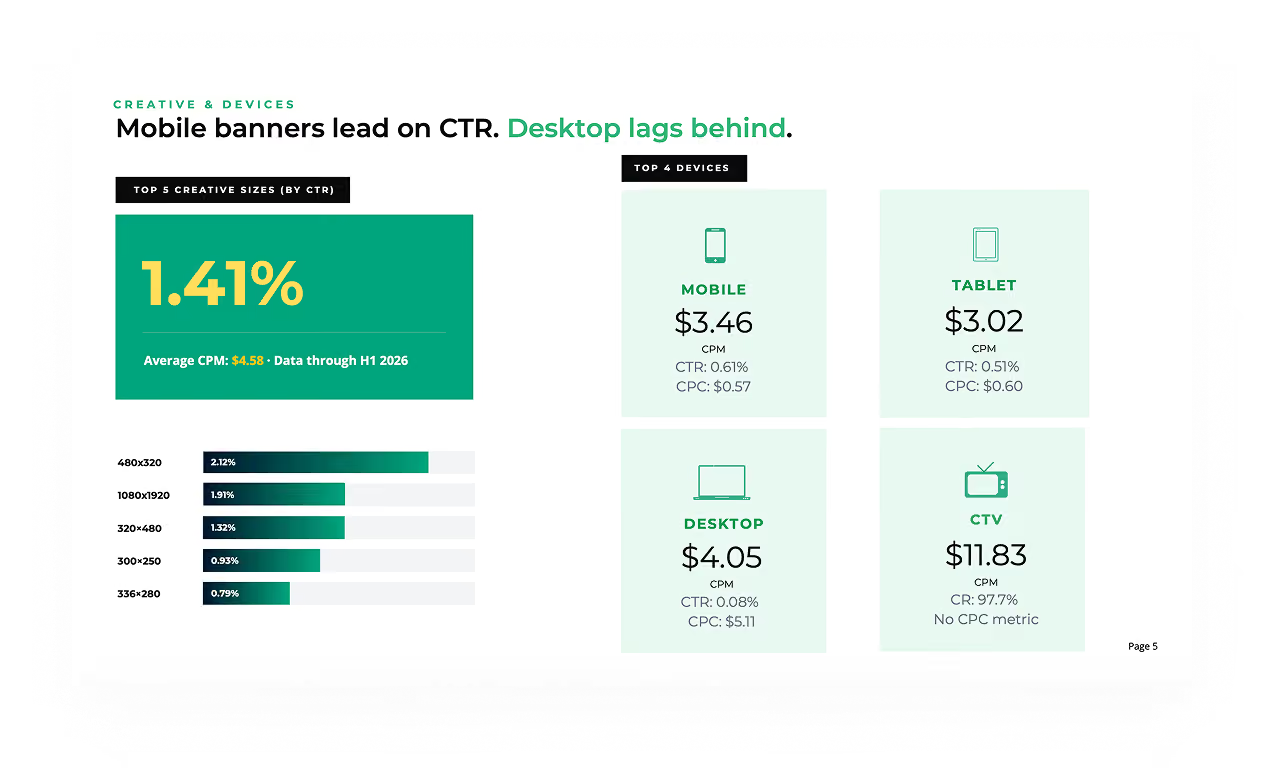
Mobile ads lead with a 1.41% CTR. The desktop average is 0.08%. That's a 17x difference — and it's just one data point in the report.

Download Report
Share this report
Report showing mobile banners lead in click-through rate (CTR) with 1.41% average CTR and $4.58 average CPM through H1 2026. Top 5 creative banner sizes by CTR are 480x320 (2.12%), 1080x1920 (1.91%), 320x480 (1.32%), 300x250 (0.93%), and 336x280 (0.79%). Top 4 advertising devices listed are Mobile with $3.46 CPM, 0.61% CTR, $0.57 CPC; Tablet with $3.02 CPM, 0.51% CTR, $0.60 CPC; Desktop with $4.05 CPM, 0.08% CTR, $5.11 CPC; and Connected TV (CTV) with $11.83 CPM, 97.7% conversion rate, and no CPC metric.

The device gap nobody talks about.

Mobile ads lead with a 1.41% CTR. The desktop average is 0.08%. That's a 17x difference — and it's just one data point in the report.

Download Report
Share this report
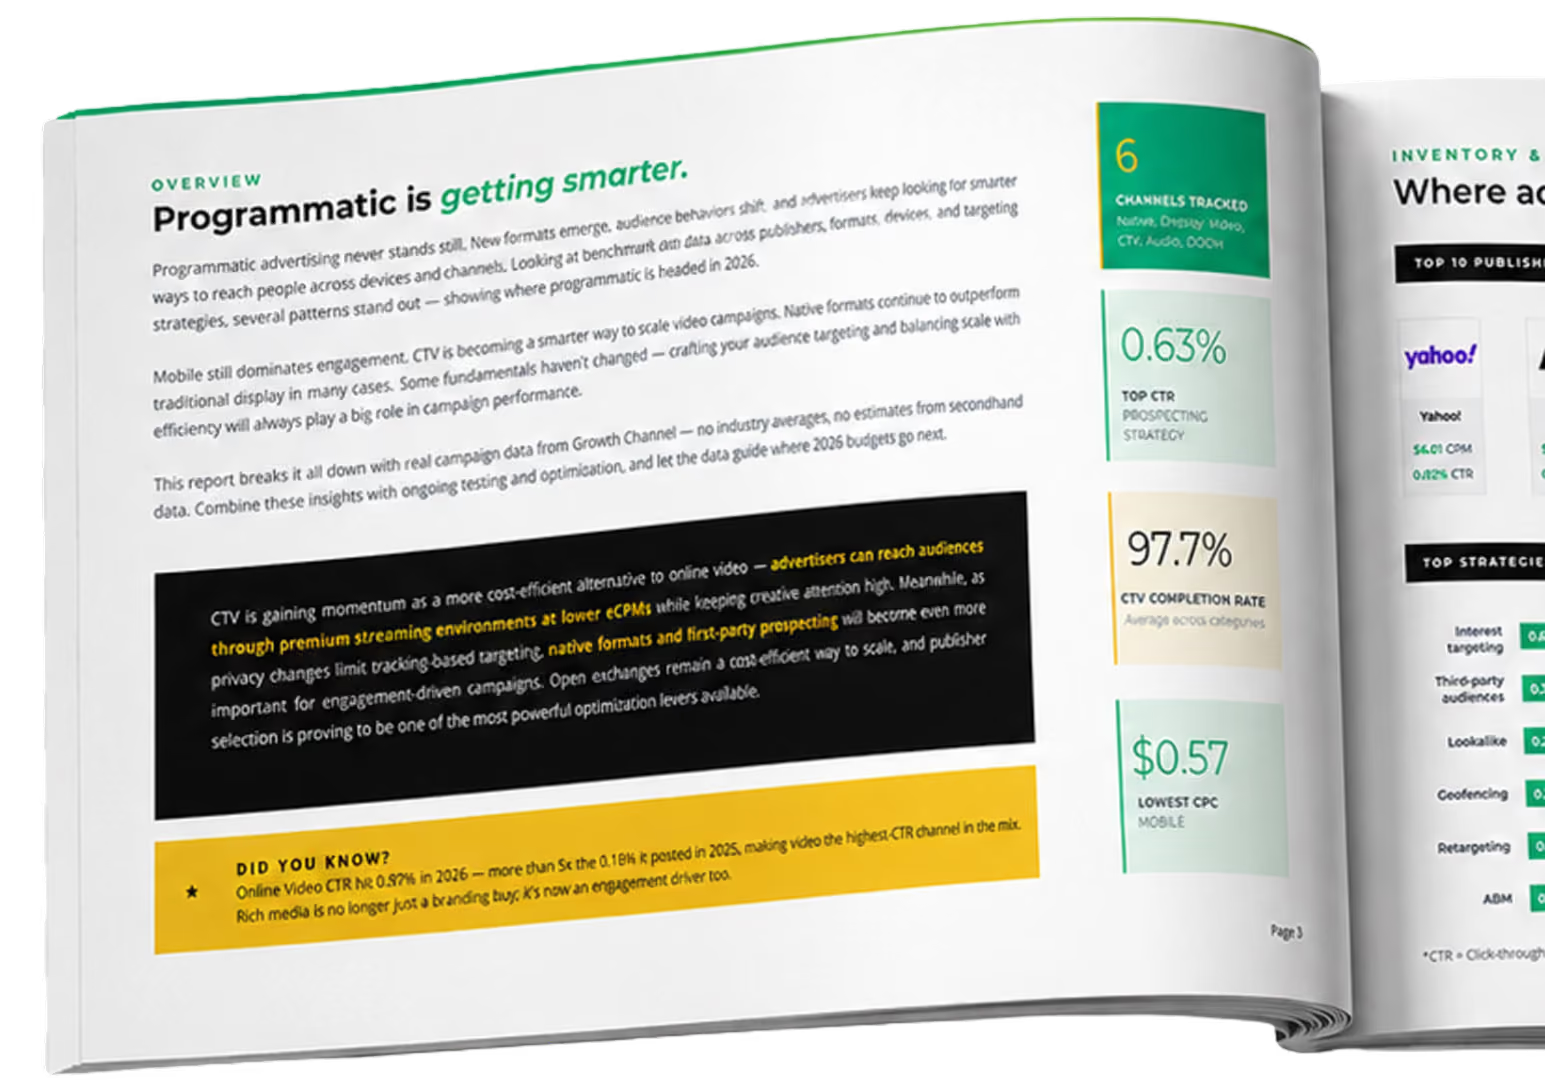
Open book page titled Programmatic is getting smarter with text on advertising and stats on right side.

What you'll walk away knowing

Plan, launch, and measure campaigns across CTV, DOOH, Audio, Display, and Mobile using one consistent audience.
01
Channel benchmarks

Know if your CTV, audio, display, and video beat the platform average — and what a click should actually cost.

02
Top 10 publishers

Point budget at inventory that performed; cut what didn't. The 10 publishers that delivered, ranked.

03
Strategy performance

See which targeting wins the most clicks per dollar — Prospecting, Retargeting, Lookalike — before you commit spend.

04
Ad exchange comparison

Same inventory, very different cost. 10 exchanges ranked on efficiency, so you stop overpaying for reach.

05
Creative sizes & devices

Brief the sizes and devices that get clicked. Skip the ones that just fill space.

06
Launch & manage

Activate and optimize omnichannel campaigns according to each campaign's objectives in a single unified dashboard.

Download the free report

Benchmarks tell you where you stand. The platform helps you beat them.

"This report is the first thing I pull when I'm evaluating campaign performance or planning a new channel mix. The category breakdowns alone save hours of digging."

— CMO, SaaS Company

Get the 2026 Programmatic Benchmark Report